Summary
Sustainable development demands reliable water resources, yet traditional
water management has broadly failed to avoid environmental degradation and
contain infrastructure costs. We explore the global-scale feasibility of combining
natural capital with engineering-based (green-gray) approaches to meet water
security threats over the 21st century. Threats to water resource systems are
projected to rise throughout this period, together with a significant expansion
in engineering deployments and progressive loss of natural capital. In many parts
of the world, strong path dependencies are projected to arise from the legacy of
prior environmental degradation that constrains future water management to a heavy
reliance on engineering-based approaches. Elsewhere, retaining existing stocks of
natural capital creates opportunities to employ blended green-gray water infrastructure.
By 2050, annual engineering expenditures are projected to triple to $2.3 trillion,
invested mainly in developing economies. In contrast, preserving natural capital for
threat suppression represents a potential $3.0 trillion in avoided replacement costs
by mid-century. Society pays a premium whenever these nature-based assets are lost,
as the engineering costs necessary to achieve an equivalent level of threat management
are, on average, twice as expensive. Countries projected to rapidly expand their
engineering investments while losing natural capital will be most constrained in
realizing green-gray water management. The situation is expected to be most restrictive
across the developing world, where the economic, technical, and governance capacities
to overcome such challenges remain limited. Our results demonstrate that policies that
support blended green-gray approaches offer a pathway to future global water security
but will require a strategic commitment to preserving natural capital. Absent such
stewardship, the costs of water resource infrastructure and services will likely rise
substantially and frustrate efforts to attain universal and sustainable water security.
Tables
Table 1
Global estimates of rising expenditures in traditional engineering (TE),
natural capital (NC) benefits expressed as avoided replacement costs, and
the penalties incurred should NC be lost and replaced by TE.
Allocations for TE infrastructure accommodate expanding water demands and loss of NC over time. The costs to remediate remaining threat, unrecovered by this TE, are also substantial, exceeding TE expenditures in the early part of the century until TE expenditures accelerate. Intact NC dampens otherwise higher levels of threat and greatly exceeds the value of TE threat mitigation. Relative contributions of NC decline over time due to degraded ecosystem services and expanding reliance on TE. All values in the first three rows are in billions of US $ 2020 PPP a; for NC these represent TE-based avoided replacement cost equivalents.
Threat Reduction by TE b 690 1,610 2,300 3,400
Threat Prevention by Existing NC c 1,380 2,330 2,950 3,900
(1,020-1,880) (1,690-3,230) (2,160-4,140) (2,850-5,450)
Remaining Threat d 1,000 1,700 2,060 2,510
Relative Contribution of NC e 67% 59% 56% 54%
Avoided Penalty f 100% 111% 114% 114%
a Converted from US $ 2005 to 2020 PPP (purchasing power parity) using BLS (2020).
b $TReng,i, total TE-based threat remediation (Spendeng, Eq. S11 for countries, as given in Supplementary Material); Eq. S12 for individual pixels. Includes the net cost of capital, operations, and maintenance.
c $TRnat,i, threat prevention considered as avoided costs. The range in parentheses shows the upper and lower limits from the power function used in Eqs. S14, S15, and S16.
d $Trem,i, the cost to remediate remaining incident threat calculated as a residual based on Eq. S19.
e Calculated relative to the sum of the value of threat reduction by TE and threat prevention by NC.
f Population-weighted avoided penalty, Pav (Eq. S18).
Figures
Fig. 1.
Conceptual framework and key water security threat nomenclature. Threat is
apportioned in
terms of its control by natural capital and traditional engineering, plus
any residual impairment. The variables shown are computed on a grid-cell
basis and denoted by i elsewhere in the text. Additional nomenclature,
intermediate steps and specific equations, input data, and assumptions are
described in the Supplementary Material. The Supplement also includes the
protocols for computing a parallel set of variables associated with replacement
cost estimates.
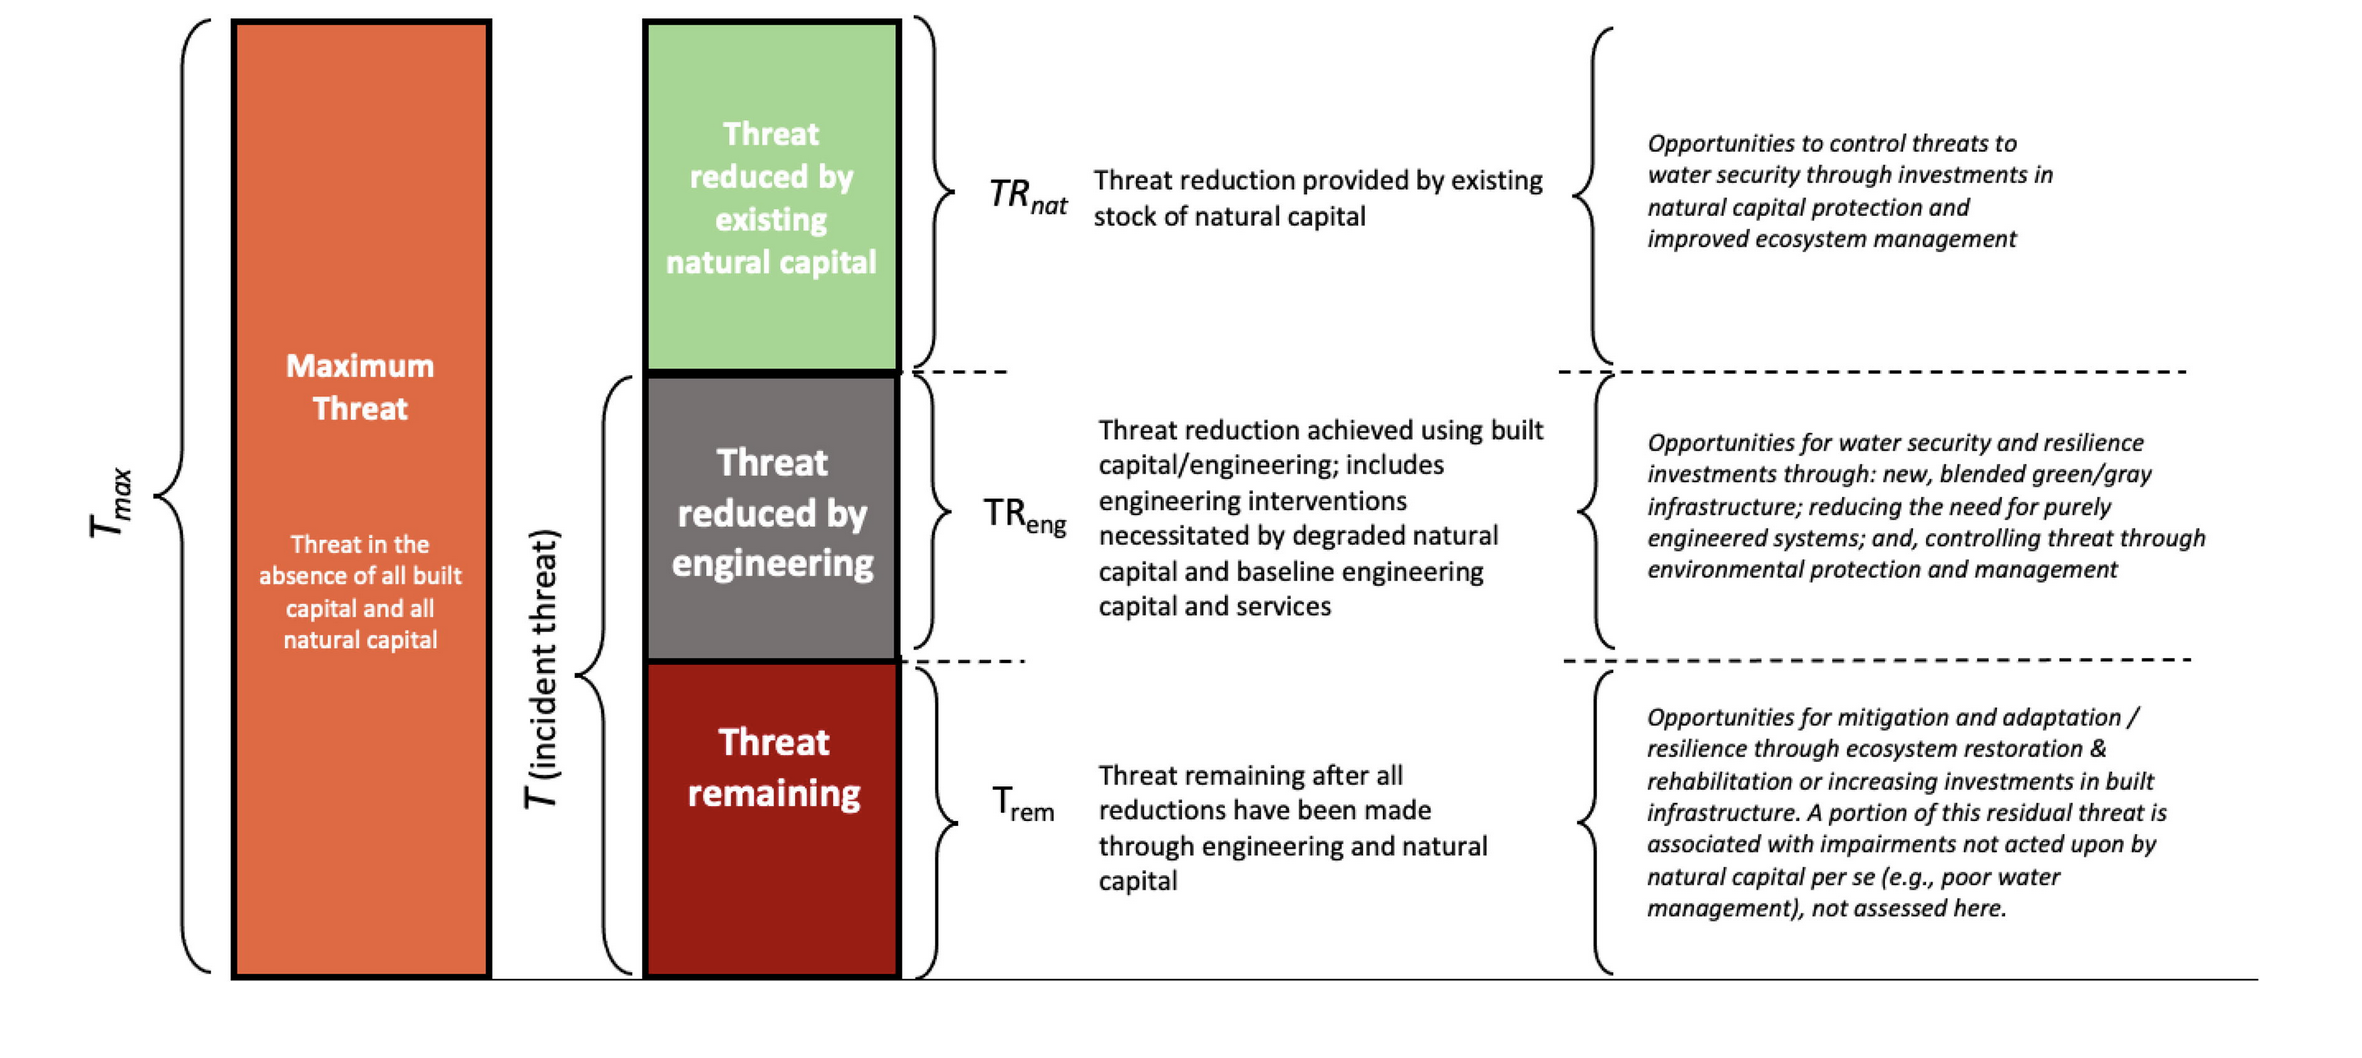
Fig. 2.
Features of water security threat and its control.
(A) Water supply conveyed to downstream populations in the
absence of human impacts.
(B) Environmental stressors produce a maximum potential
incident threat; Tmax represents the endpoint of complete
removal of natural capital and its associated threat suppression.
(C) Natural capital reduces the maximum to incident threat,
the level observed and acted upon by engineered remediation.
(D) A residual threat remains after engineered interventions.
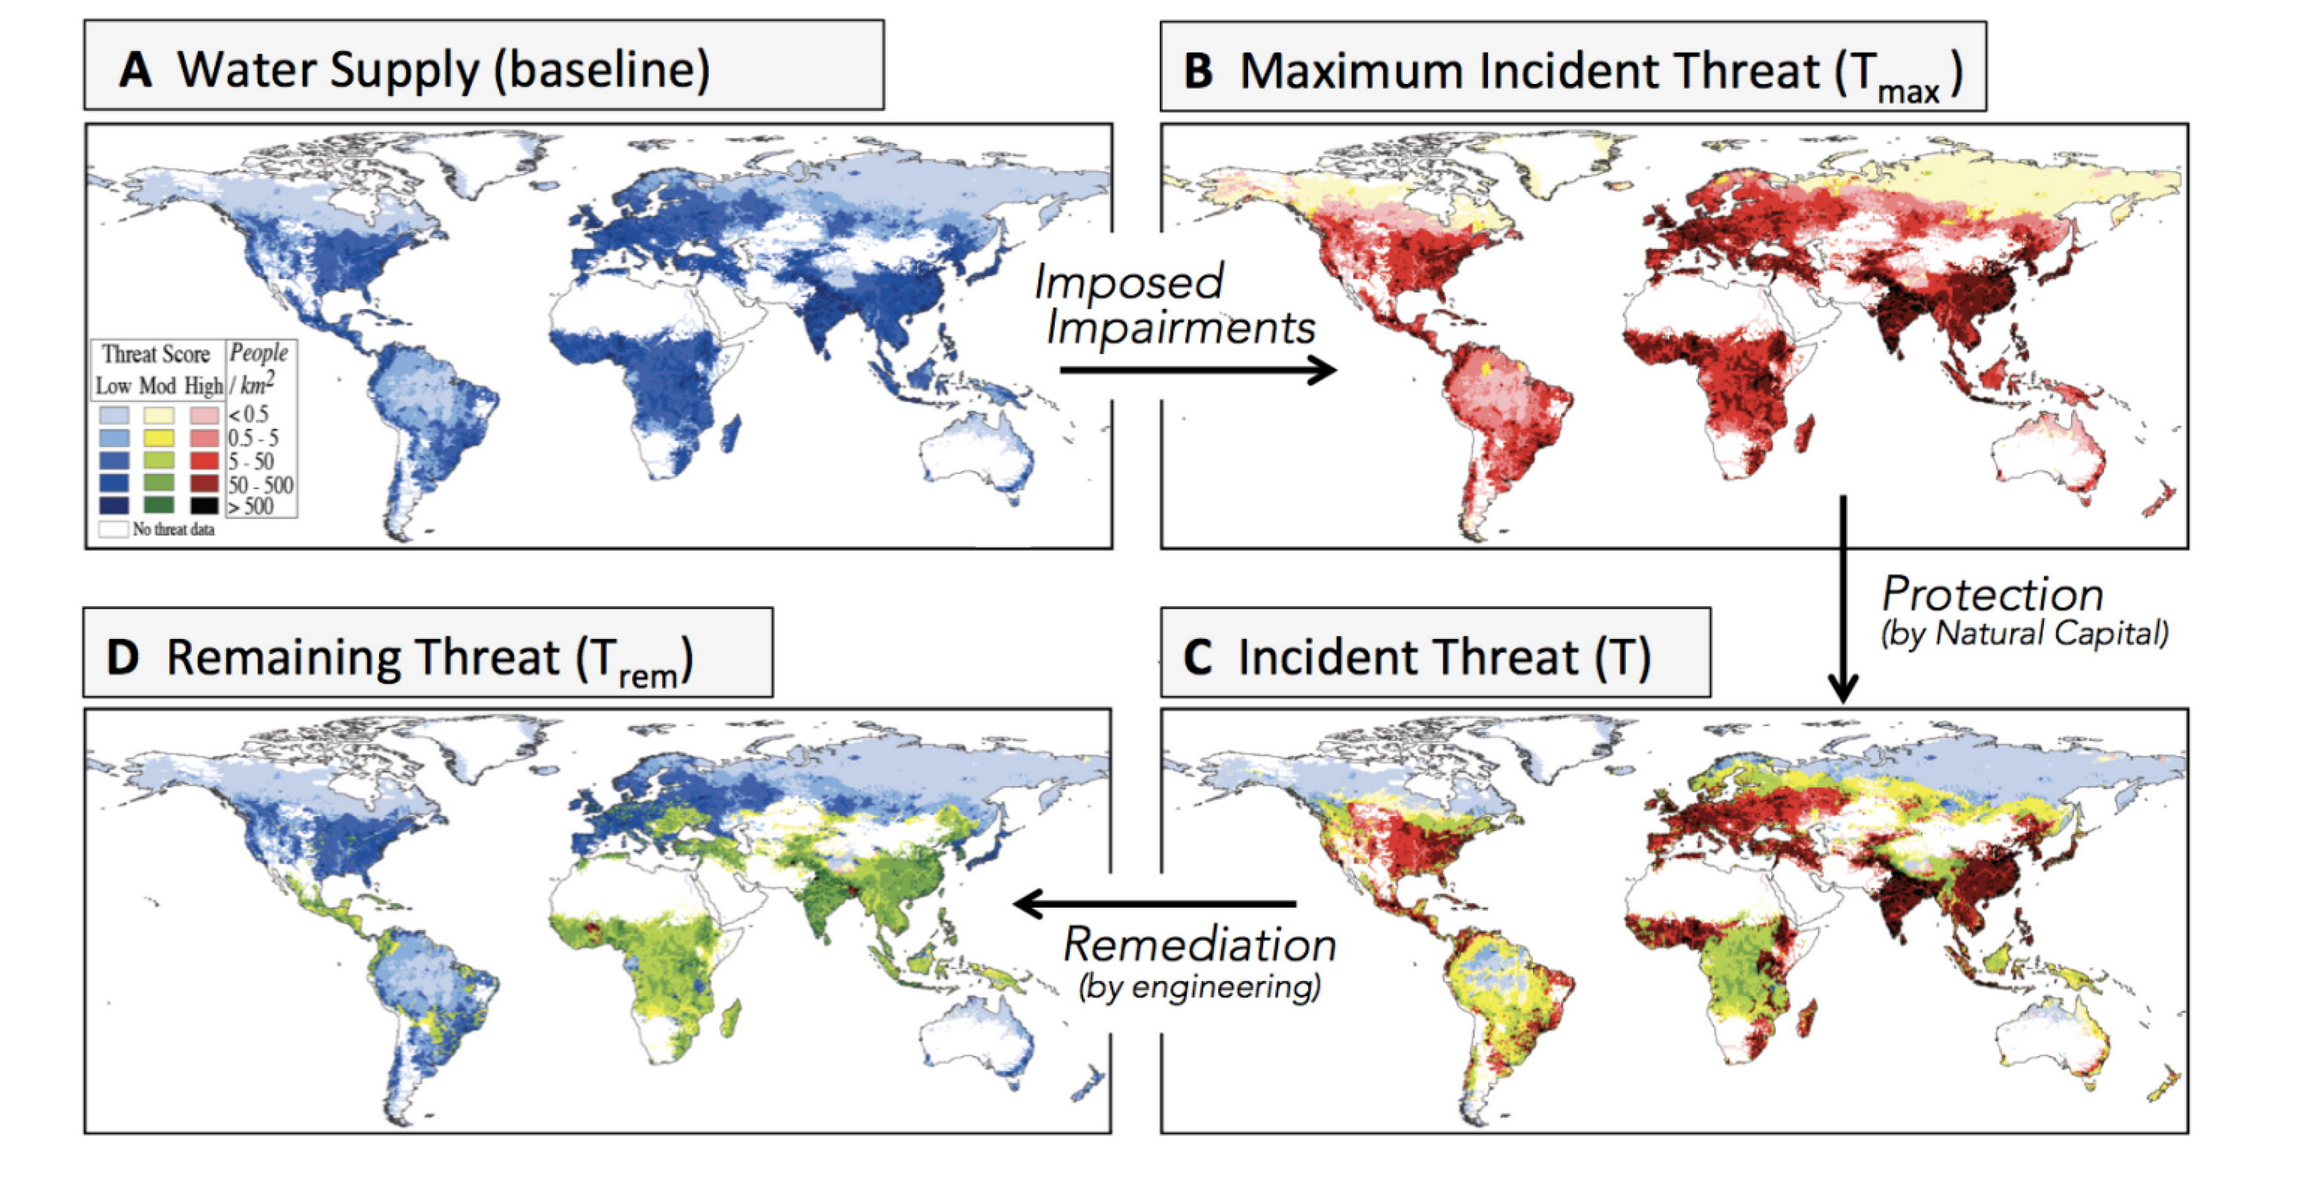
Fig. 3.
Growth and re-distribution of global income and the affiliated rise in
incident threat.
(A) The impact of anticipated global economic development
moves overall population distributions to the right, reflecting the rise of
the global middle class. Estimates are derived from the IPCC-AR5,
SSP database (SSP, 2016). All values are in GDP-PPP/capita (2000 $).
(B) Future distributions of T (for 2050) are similar to
those of the present, stabilized across the United States and Europe, but
accelerating across Western Africa, South and East Asia.
(C) Mean population-weighted trajectories for major economic
blocks reflect rapid demographic and economic growth and agricultural
intensification followed by slowing and stabilization. Pixels reported at
30’ lat/long; non-discharging landmass shown in white.
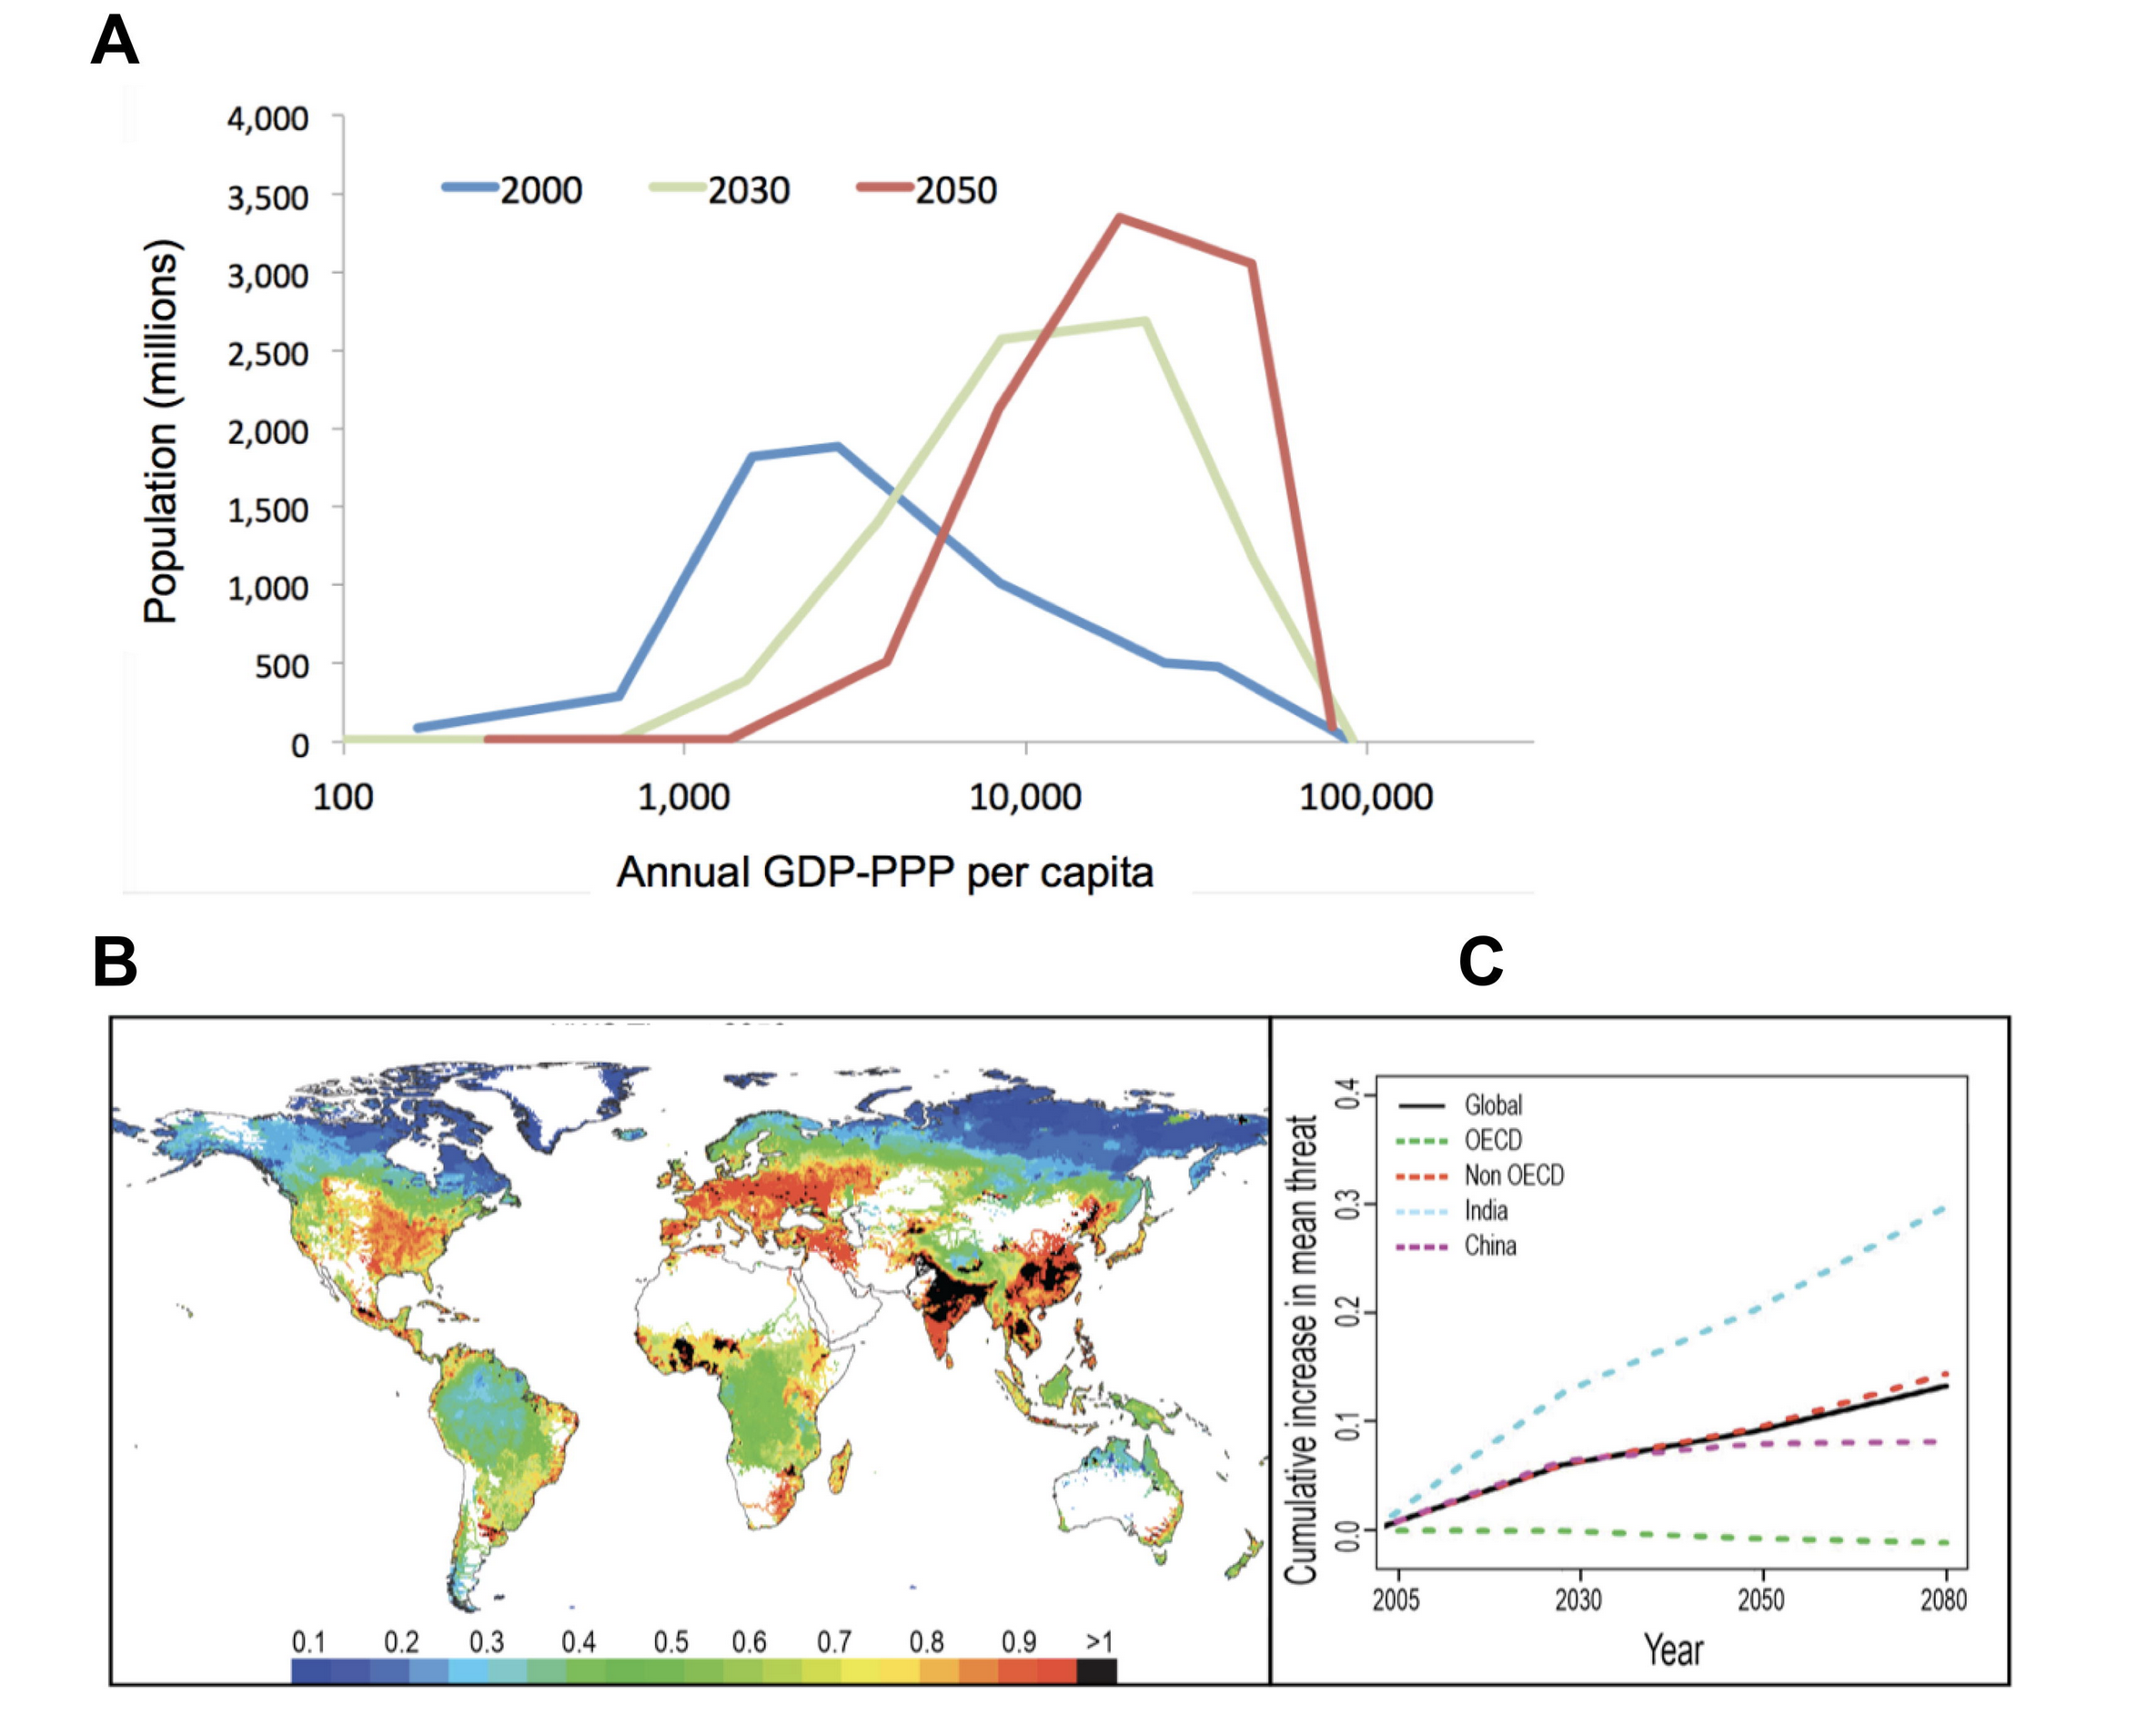
Fig. 4.
Projections of future incident threat T under the business-as-usual
(BAU) scenario. The estimates are based on IPCC
(RCP 6.0/SSP2 combination [SSP, 2016]) reflecting the spatial
distribution of regional development determined by macro-economic trends and
population growth. Throughout the simulation timeframe, threat intensifies over
previously threatened areas, in lieu of a broadening, or extensification, of the
spatial domain of T.
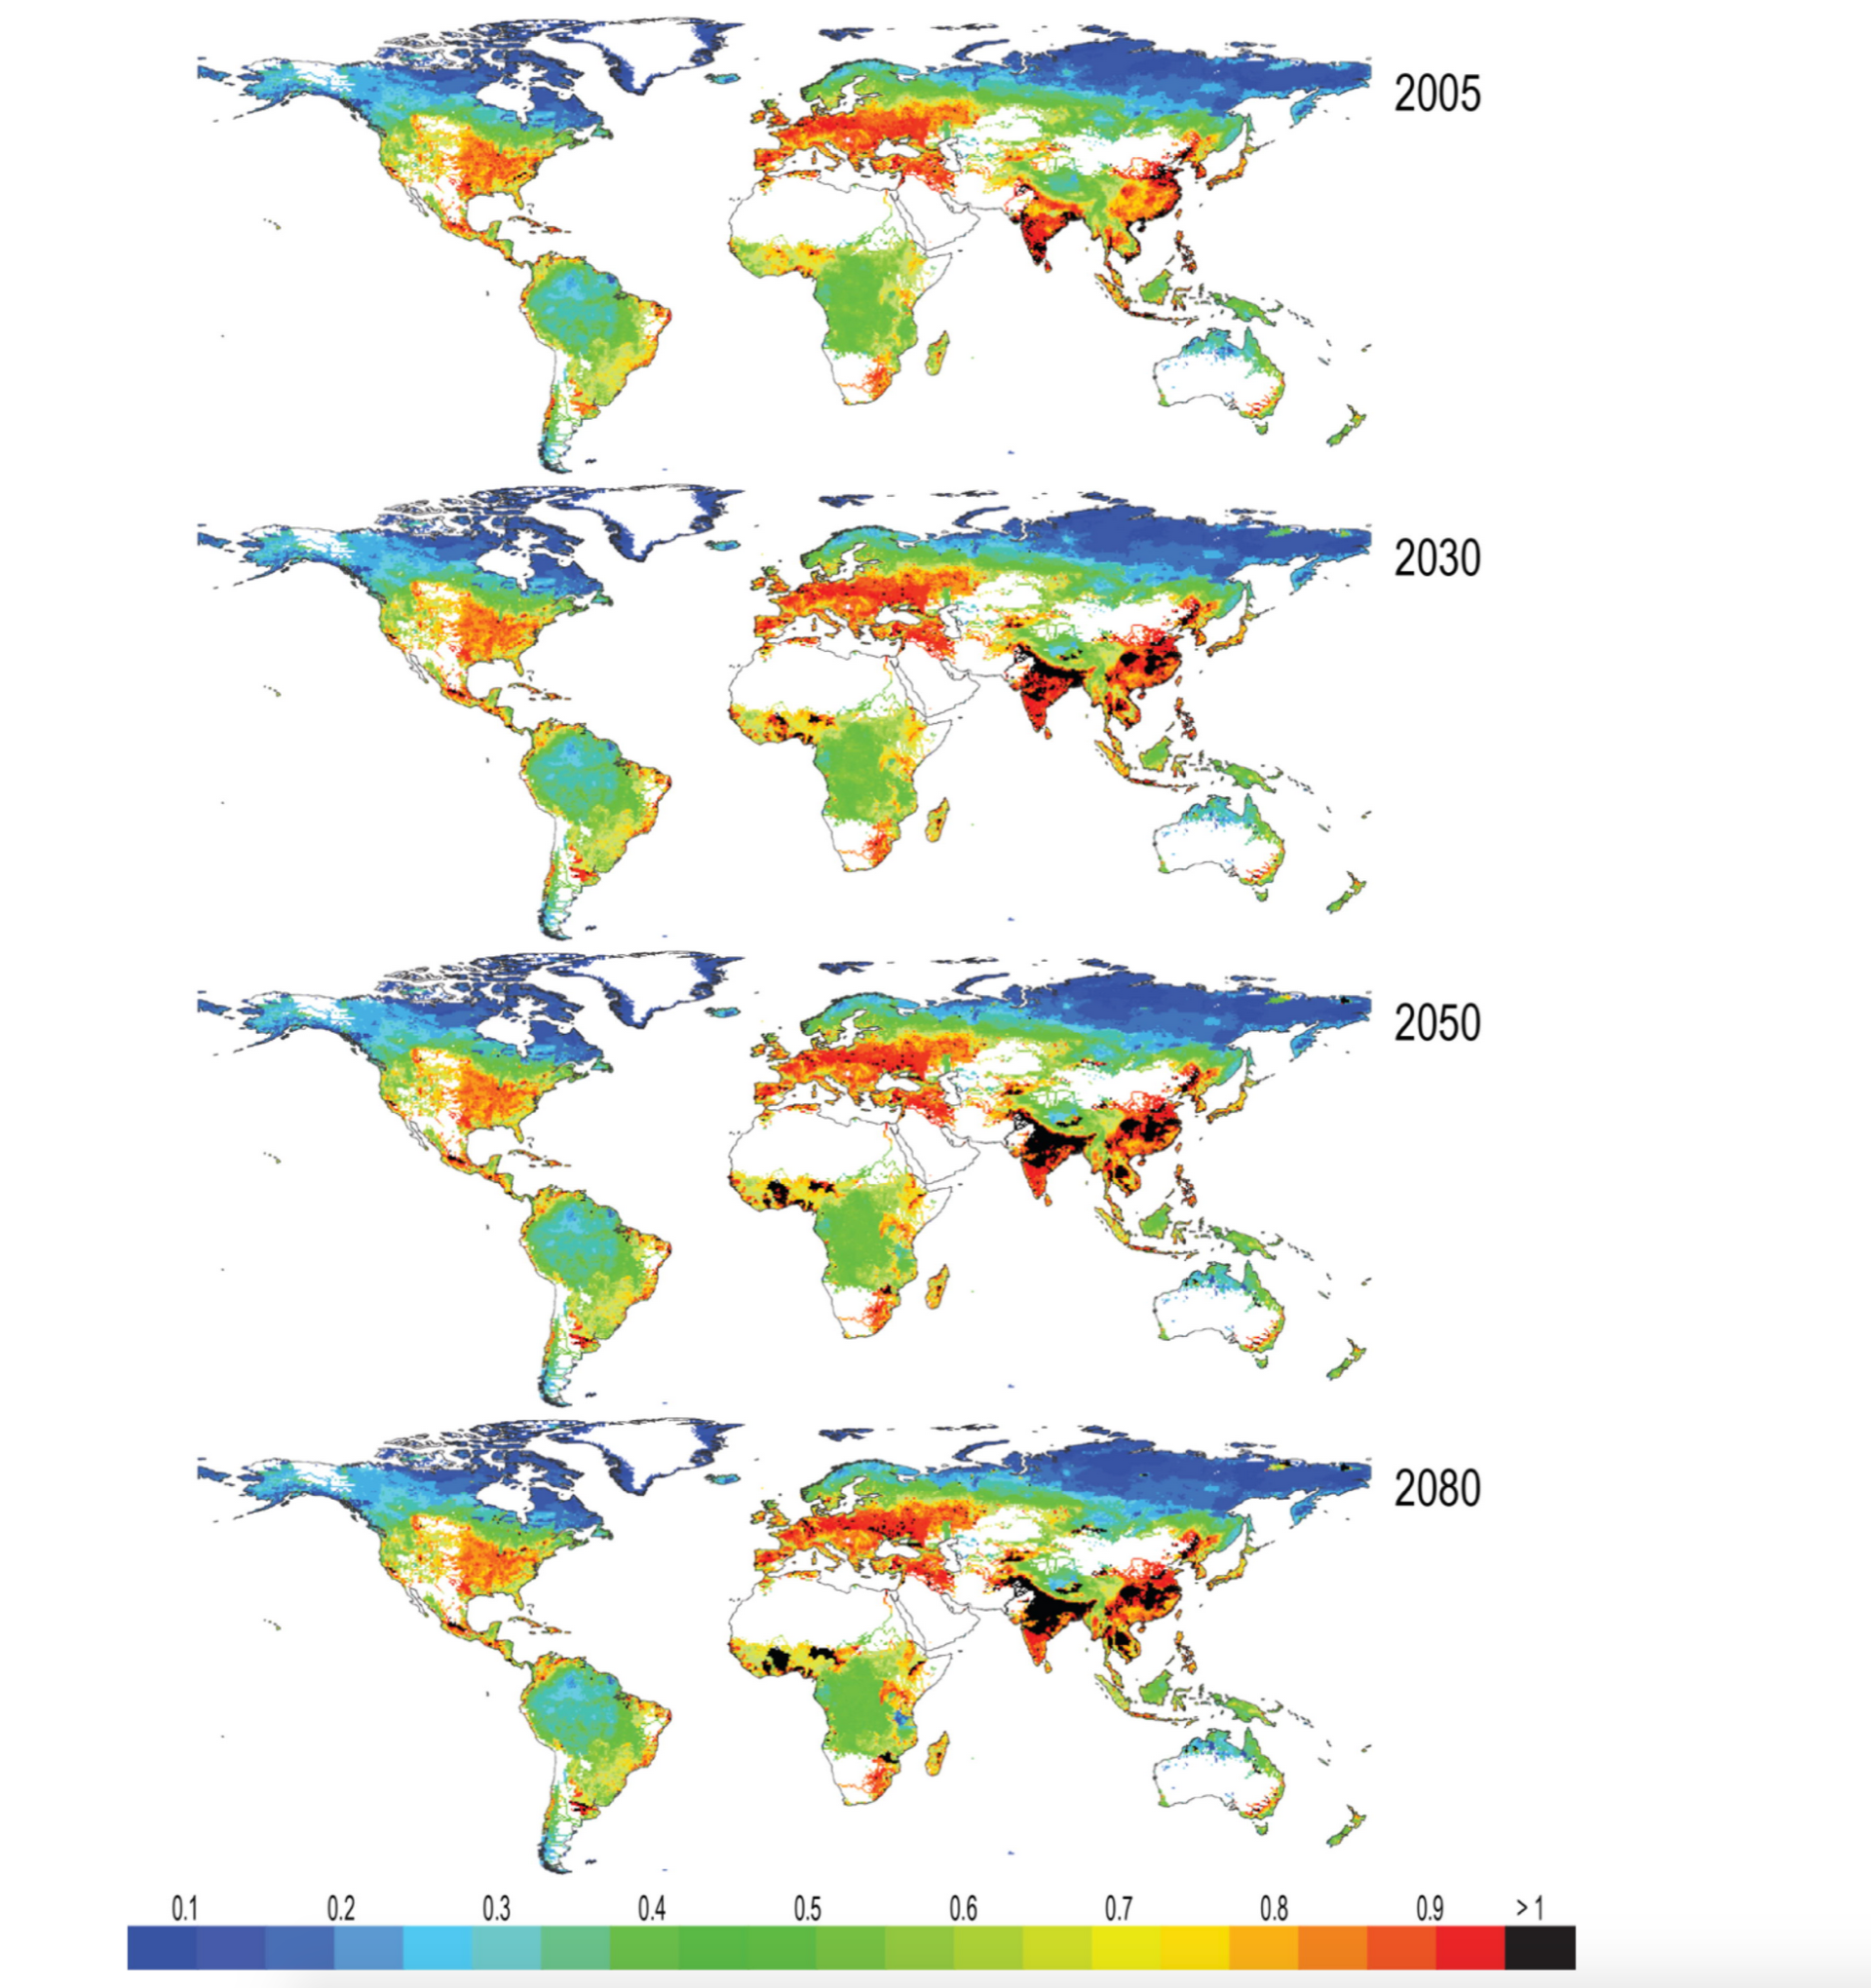
Fig. 5.
Components of incident threat containment and final threat remaining
(Trem,i) in 2050.
(A) Engineering-remediated threat reduction
(TReng,i) at point-of-service prevails in middle-to-high
income countries.
(B) TRnat,i limits otherwise higher
T and is generally inversely related
to proximity to human population and economic activity.
(C) Trem,i represents Ti
after TE interventions and accounts for the effect of NC threat
reduction.
(D) Mean values of threat components for countries grouped by
income; non-linear trajectories exist in both Ti and its
remediation by TReng,i with rising income, a pattern
consistent with present-day tendencies (1). Total threat attenuated by
engineering and natural capital is the sum of panel values in (A)
and (B) (purple and green,
respectively in panel D), in turn giving the remaining
threat (Trem,i). Ti and
TReng,i means are weighted by local population,
TRnat,i by downstream river corridor population.
TRnat,i maximum is 0.53, representing theoretically
pristine water source areas.
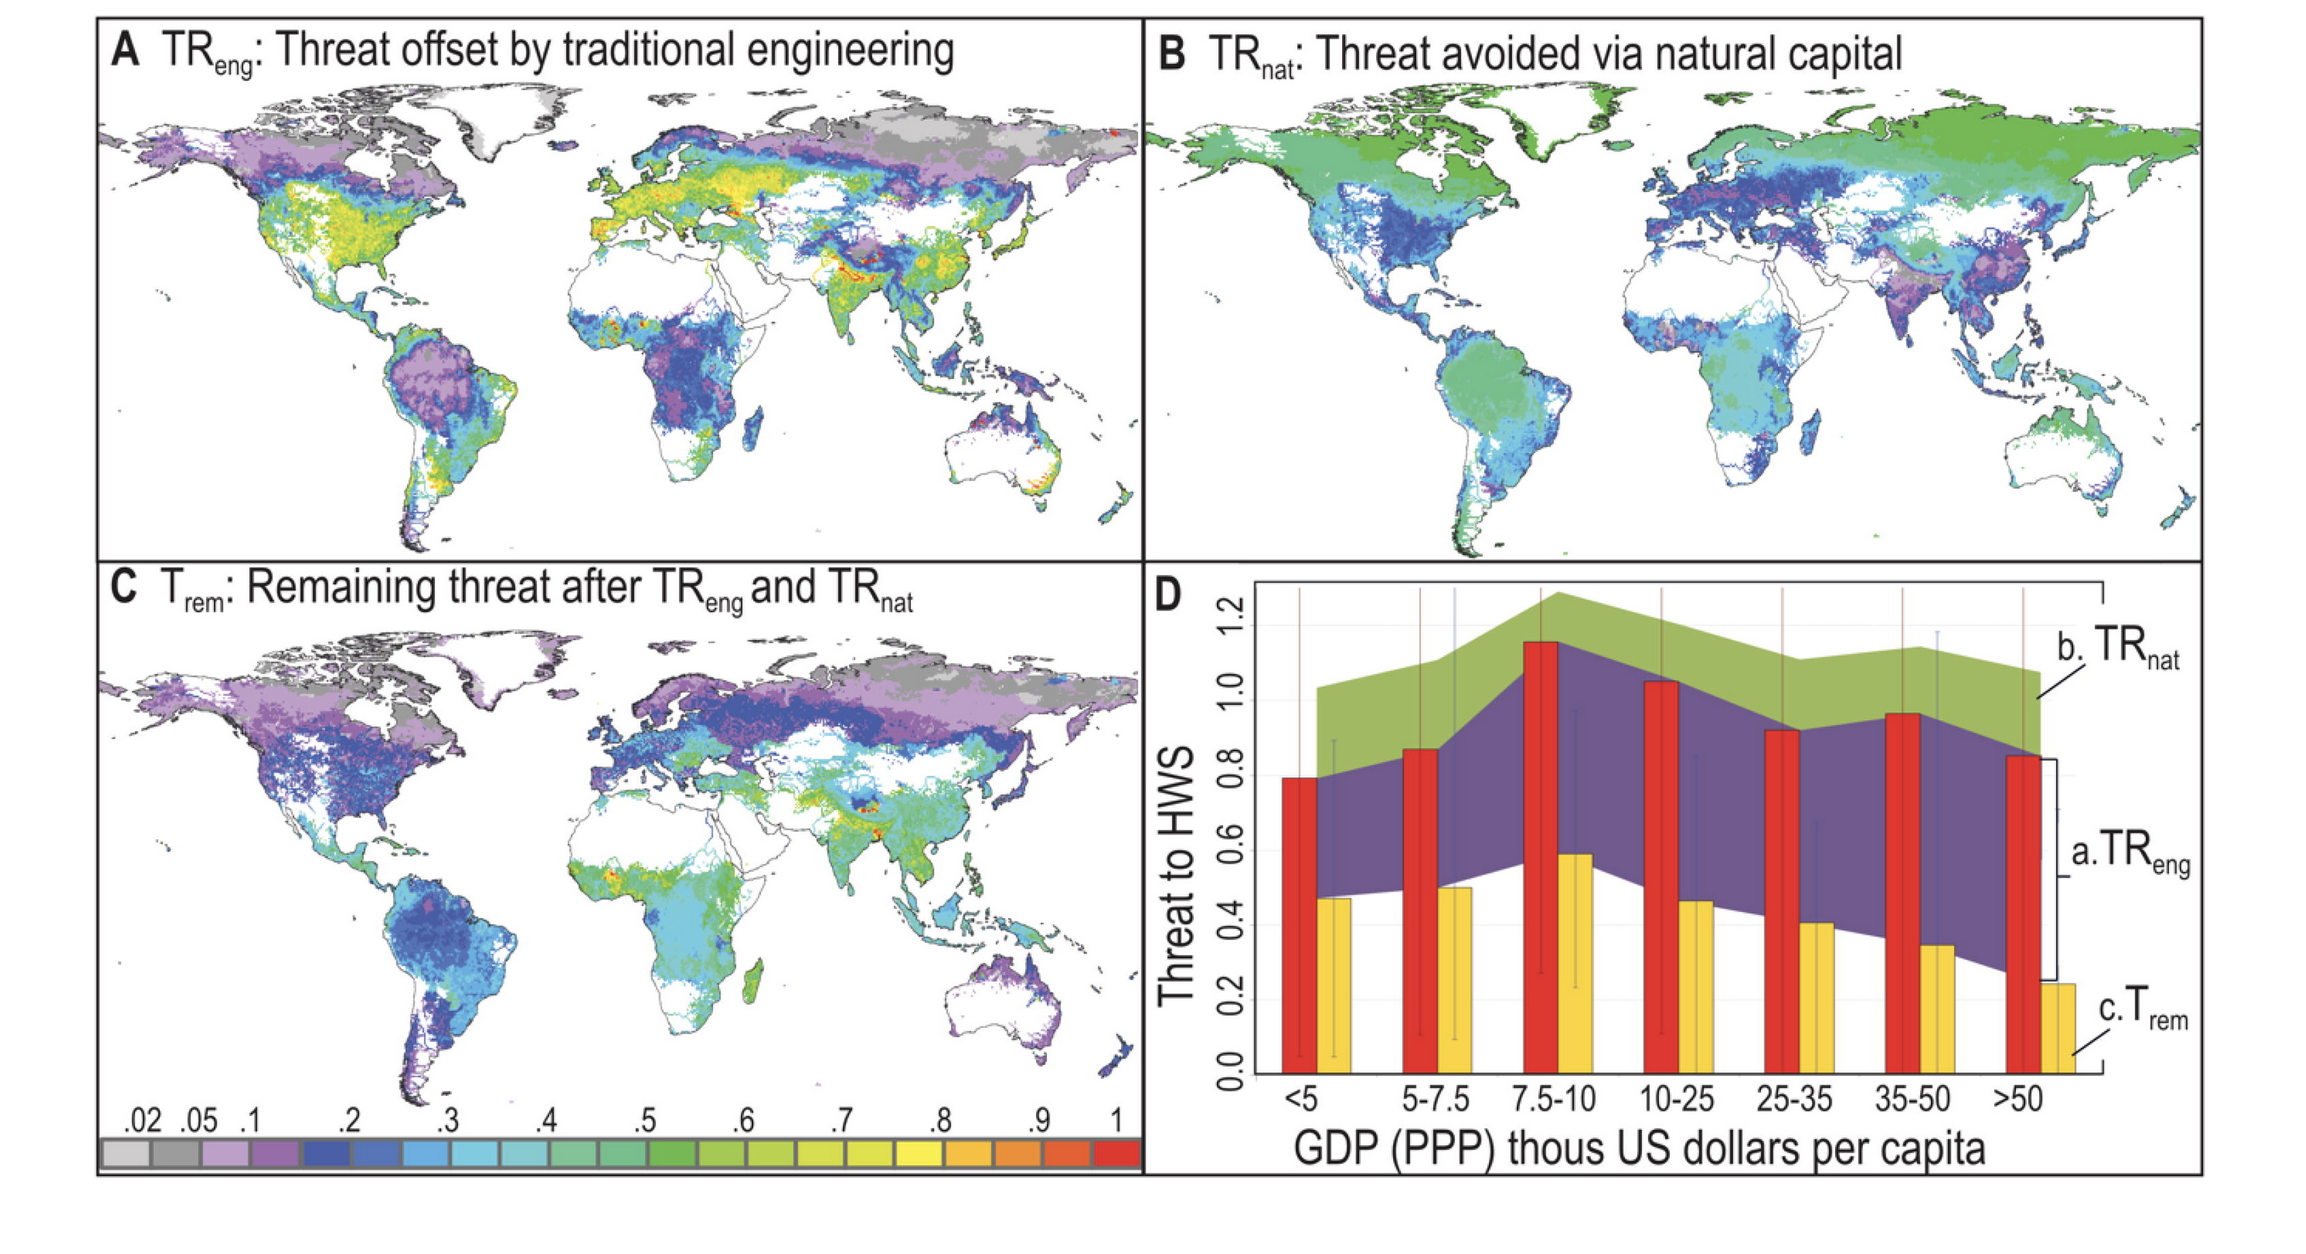
Fig. 6.
Threat control by traditional engineering and natural capital in year 2050,
relative to 2005.
(A) Threat reduction by engineering (TReng)
and
(B) natural capital
(TRnat). The business-as-usual case shows growing
emphasis on TE globally. Despite rapid growth in relative terms,
many developing world regions (e.g. sub-Saharan Africa) have limited
TE systems by mid-century in absolute terms. NC losses are a
byproduct of development, limited environmental protection, and some TE
interventions themselves (e.g., sewerage works with poor treatment; excessive
dam construction).
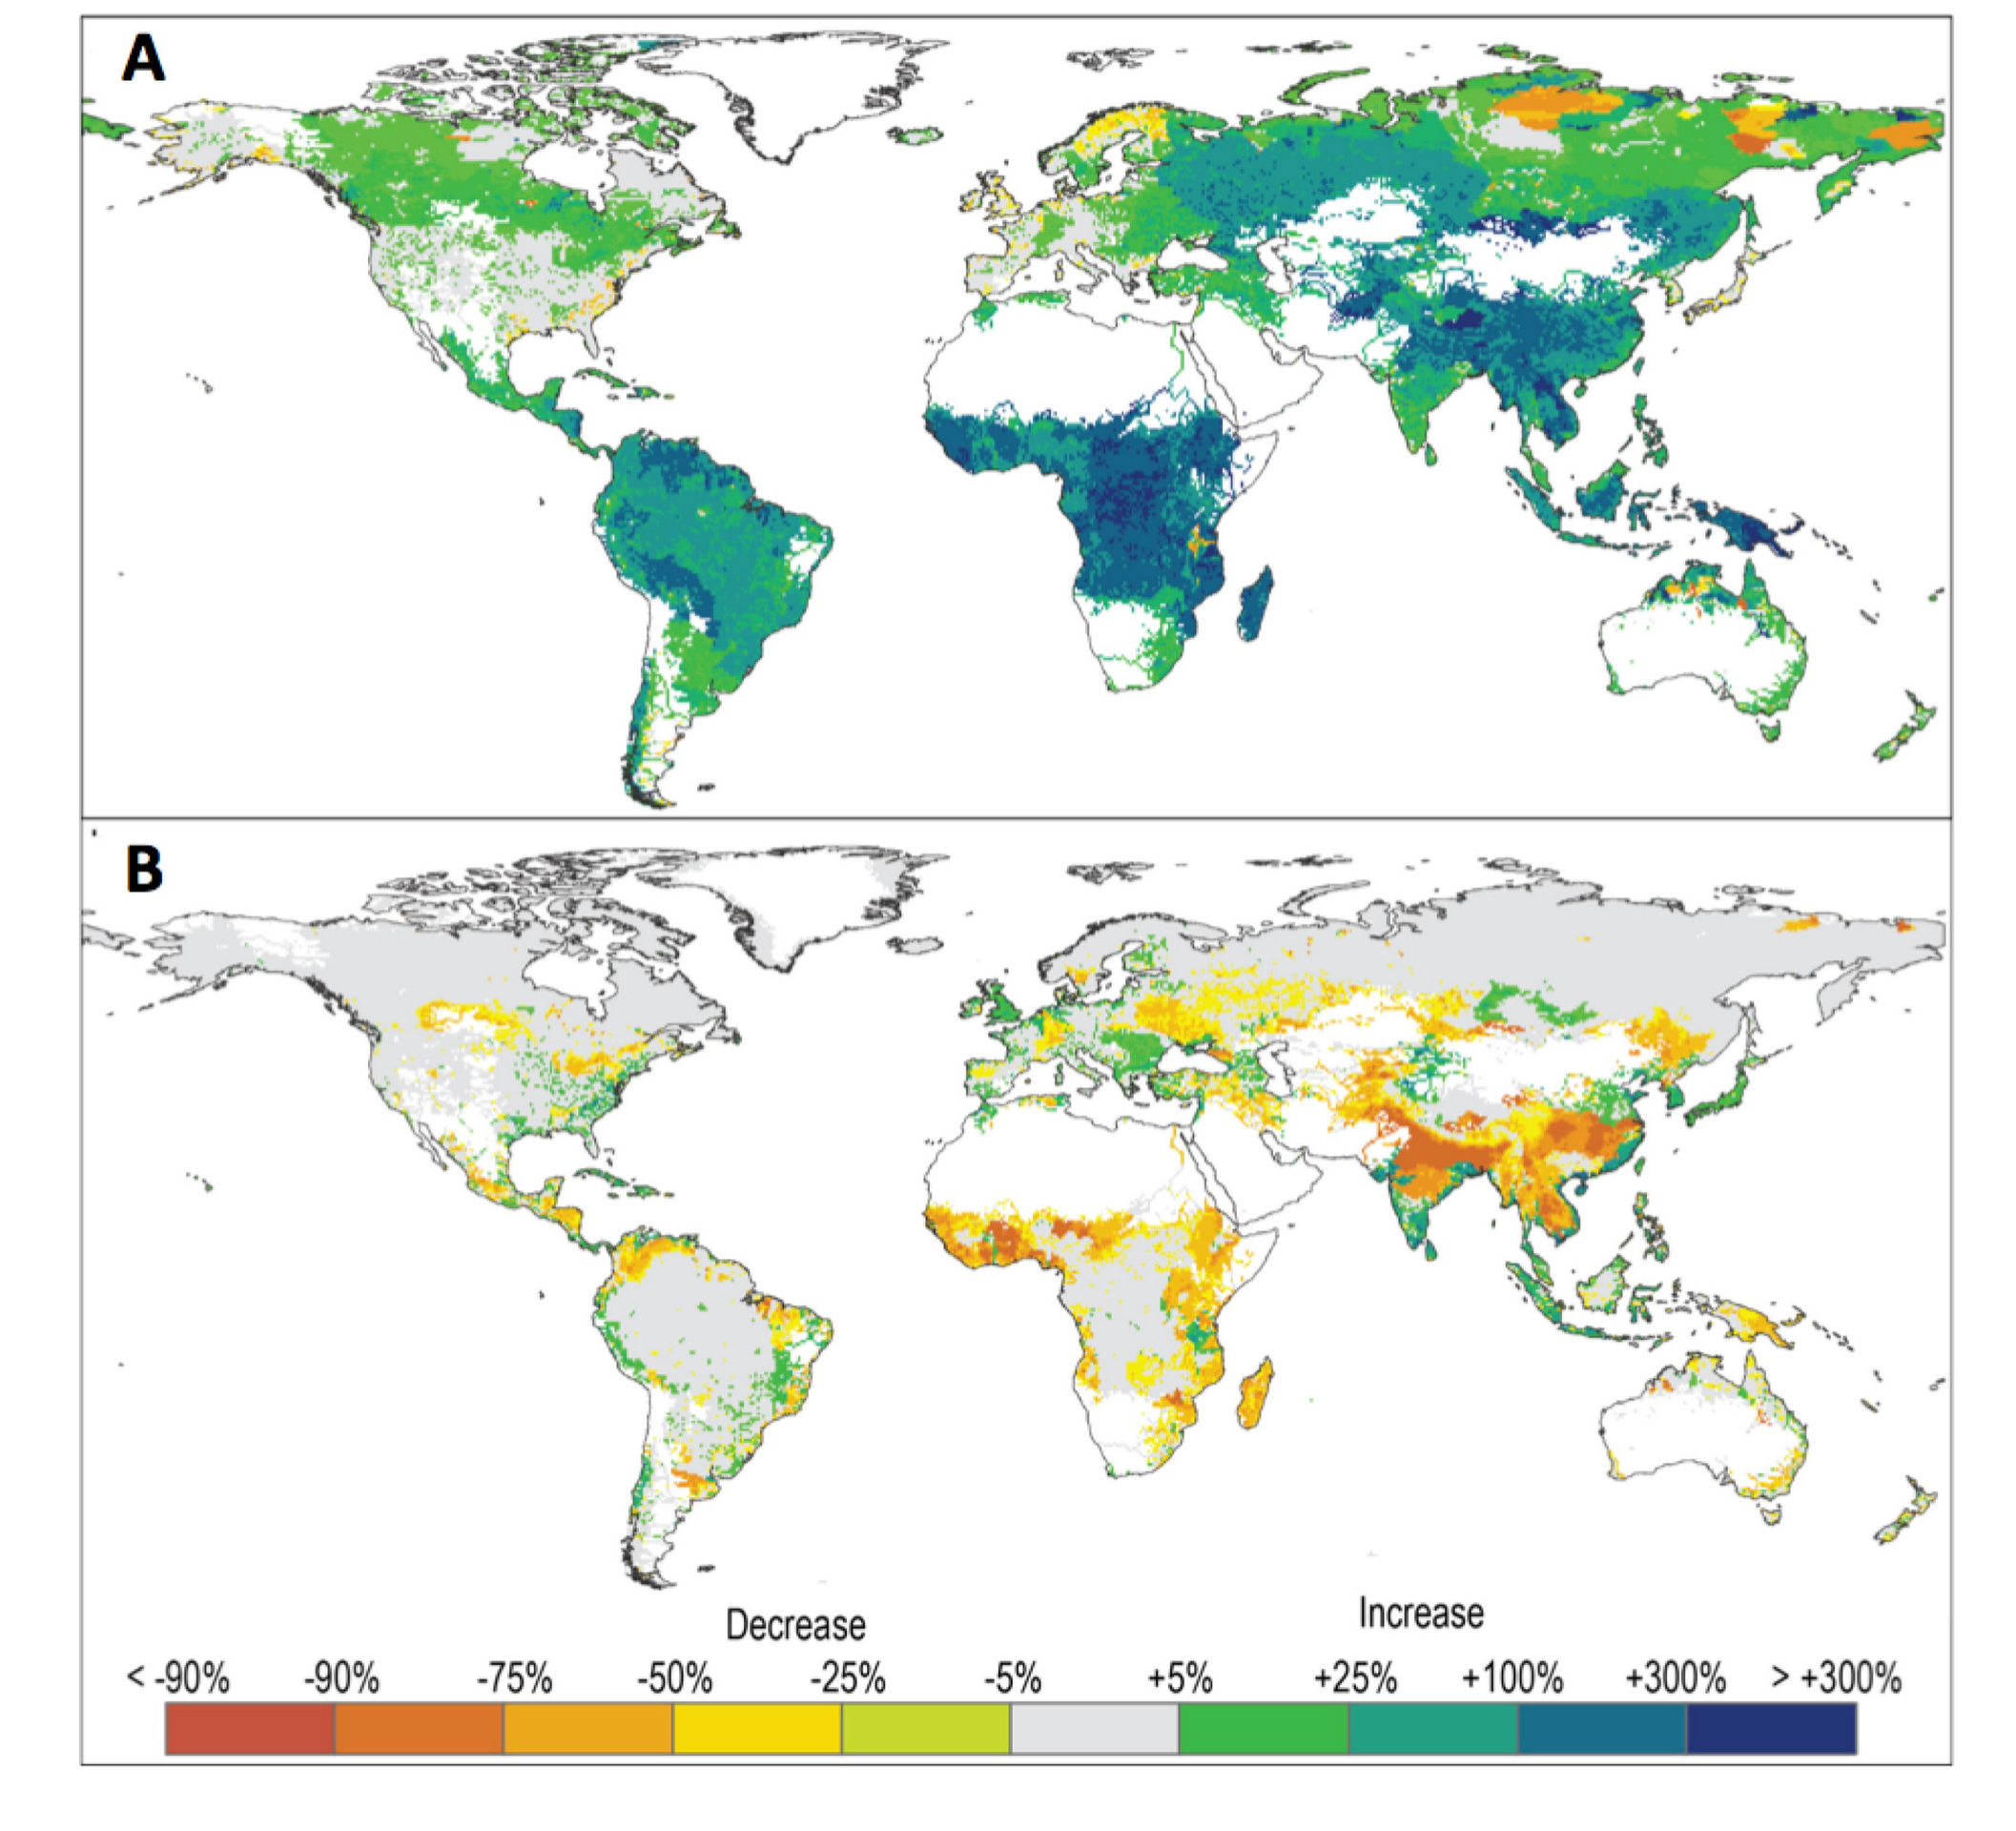
Fig. 7.
Geography of traditional engineering and natural capital in threat
management in 2005 (left) and 2050 (right).
Mapped color densities represent downstream populations served by water source
areas. Business-as-usual trends in the growth of incident threat and societal
response (Figs. 3, 4) mean that nearly all areas improve their engineered water
services and will reside in the High-TE/High-NC (green color)
or High TE / Low-NC (red) category by 2050. Red areas
suggest strong path dependencies in future threat management, requiring a nearly
exclusive reliance on TE; green indicates the potential for blending
NC-TE approaches. High-to-Low thresholds determined from
population-weighted global mean threat containment in 2005
(TReng = 0.38; TRnat
= 0.20).
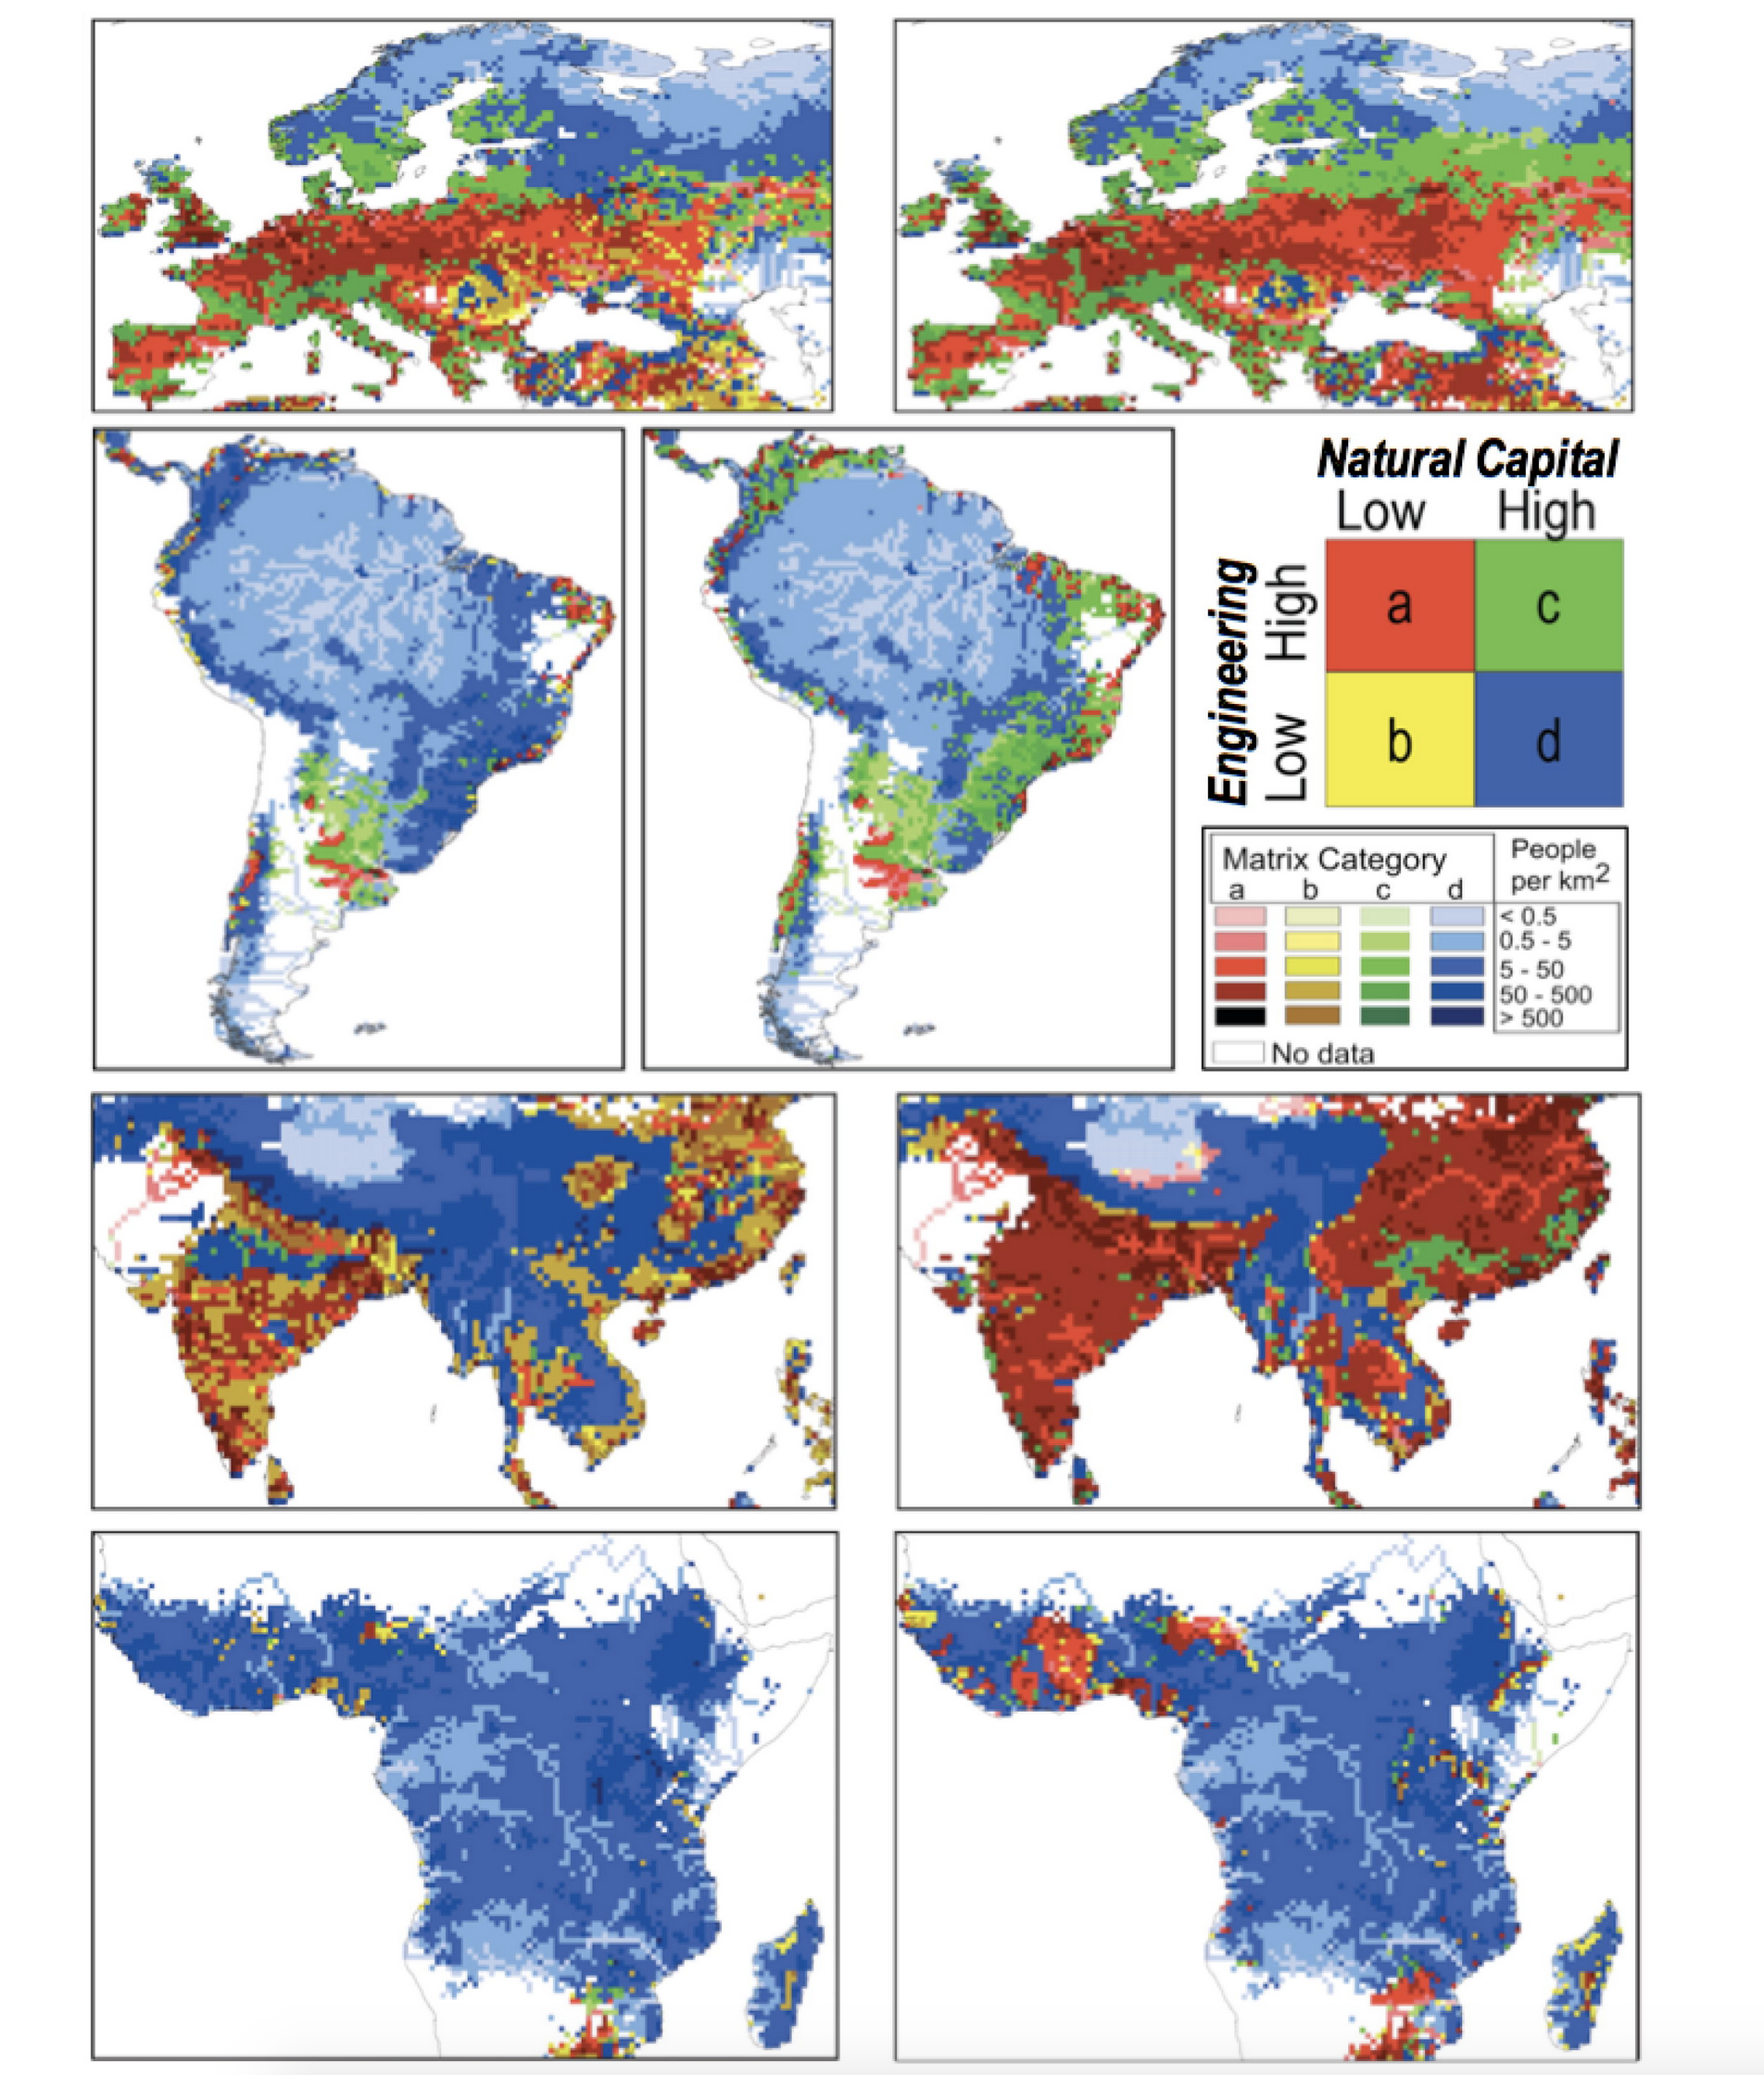
Fig. 8.
Annual replacement costs per unit area for existing natural capital
($) through
traditional engineering in 2050 in four different countries. Grey bars
represent the proportion of pixels in each country with each level of
TRnat,i on the horizontal axis. The
blue curves represent the per square km cost to replace the existing natural
capital in the pixels in each bin. Country-level specificity arises from
differences in the cost effectiveness of engineered management of threat across
the globe (Eqs. S13 & S14 in the Supplementary Material). Total replacement
cost (S
$
) and avoided penalty (Pav
) are at the national level (percent and $ 2020 PPP, respectively).
Fig. S4 in the Supplement gives the general response function.
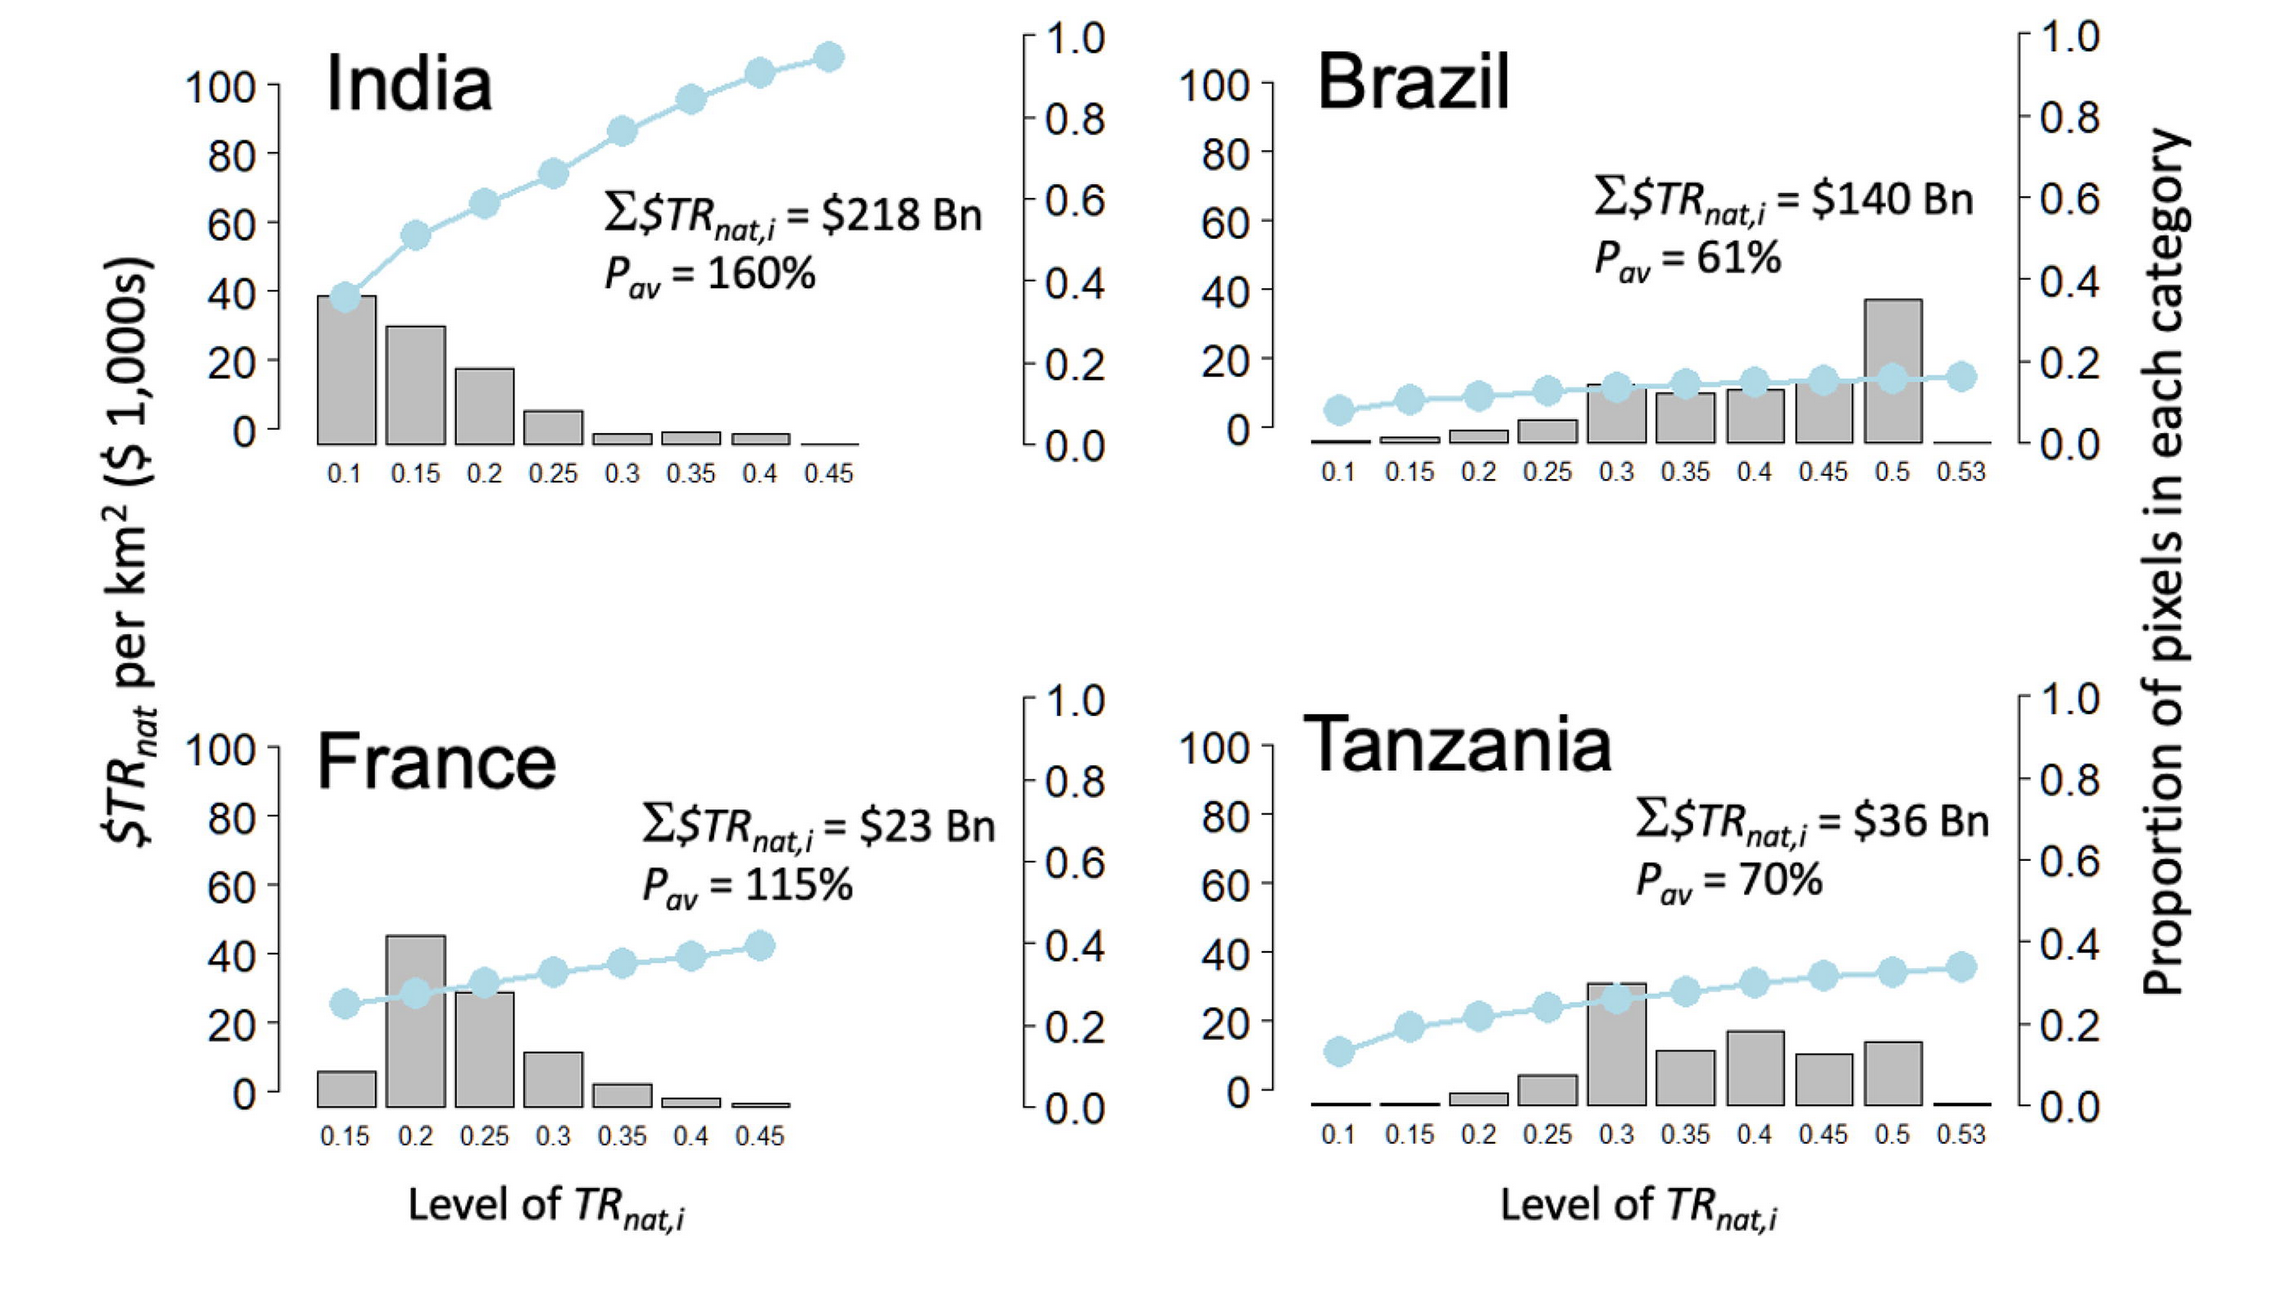
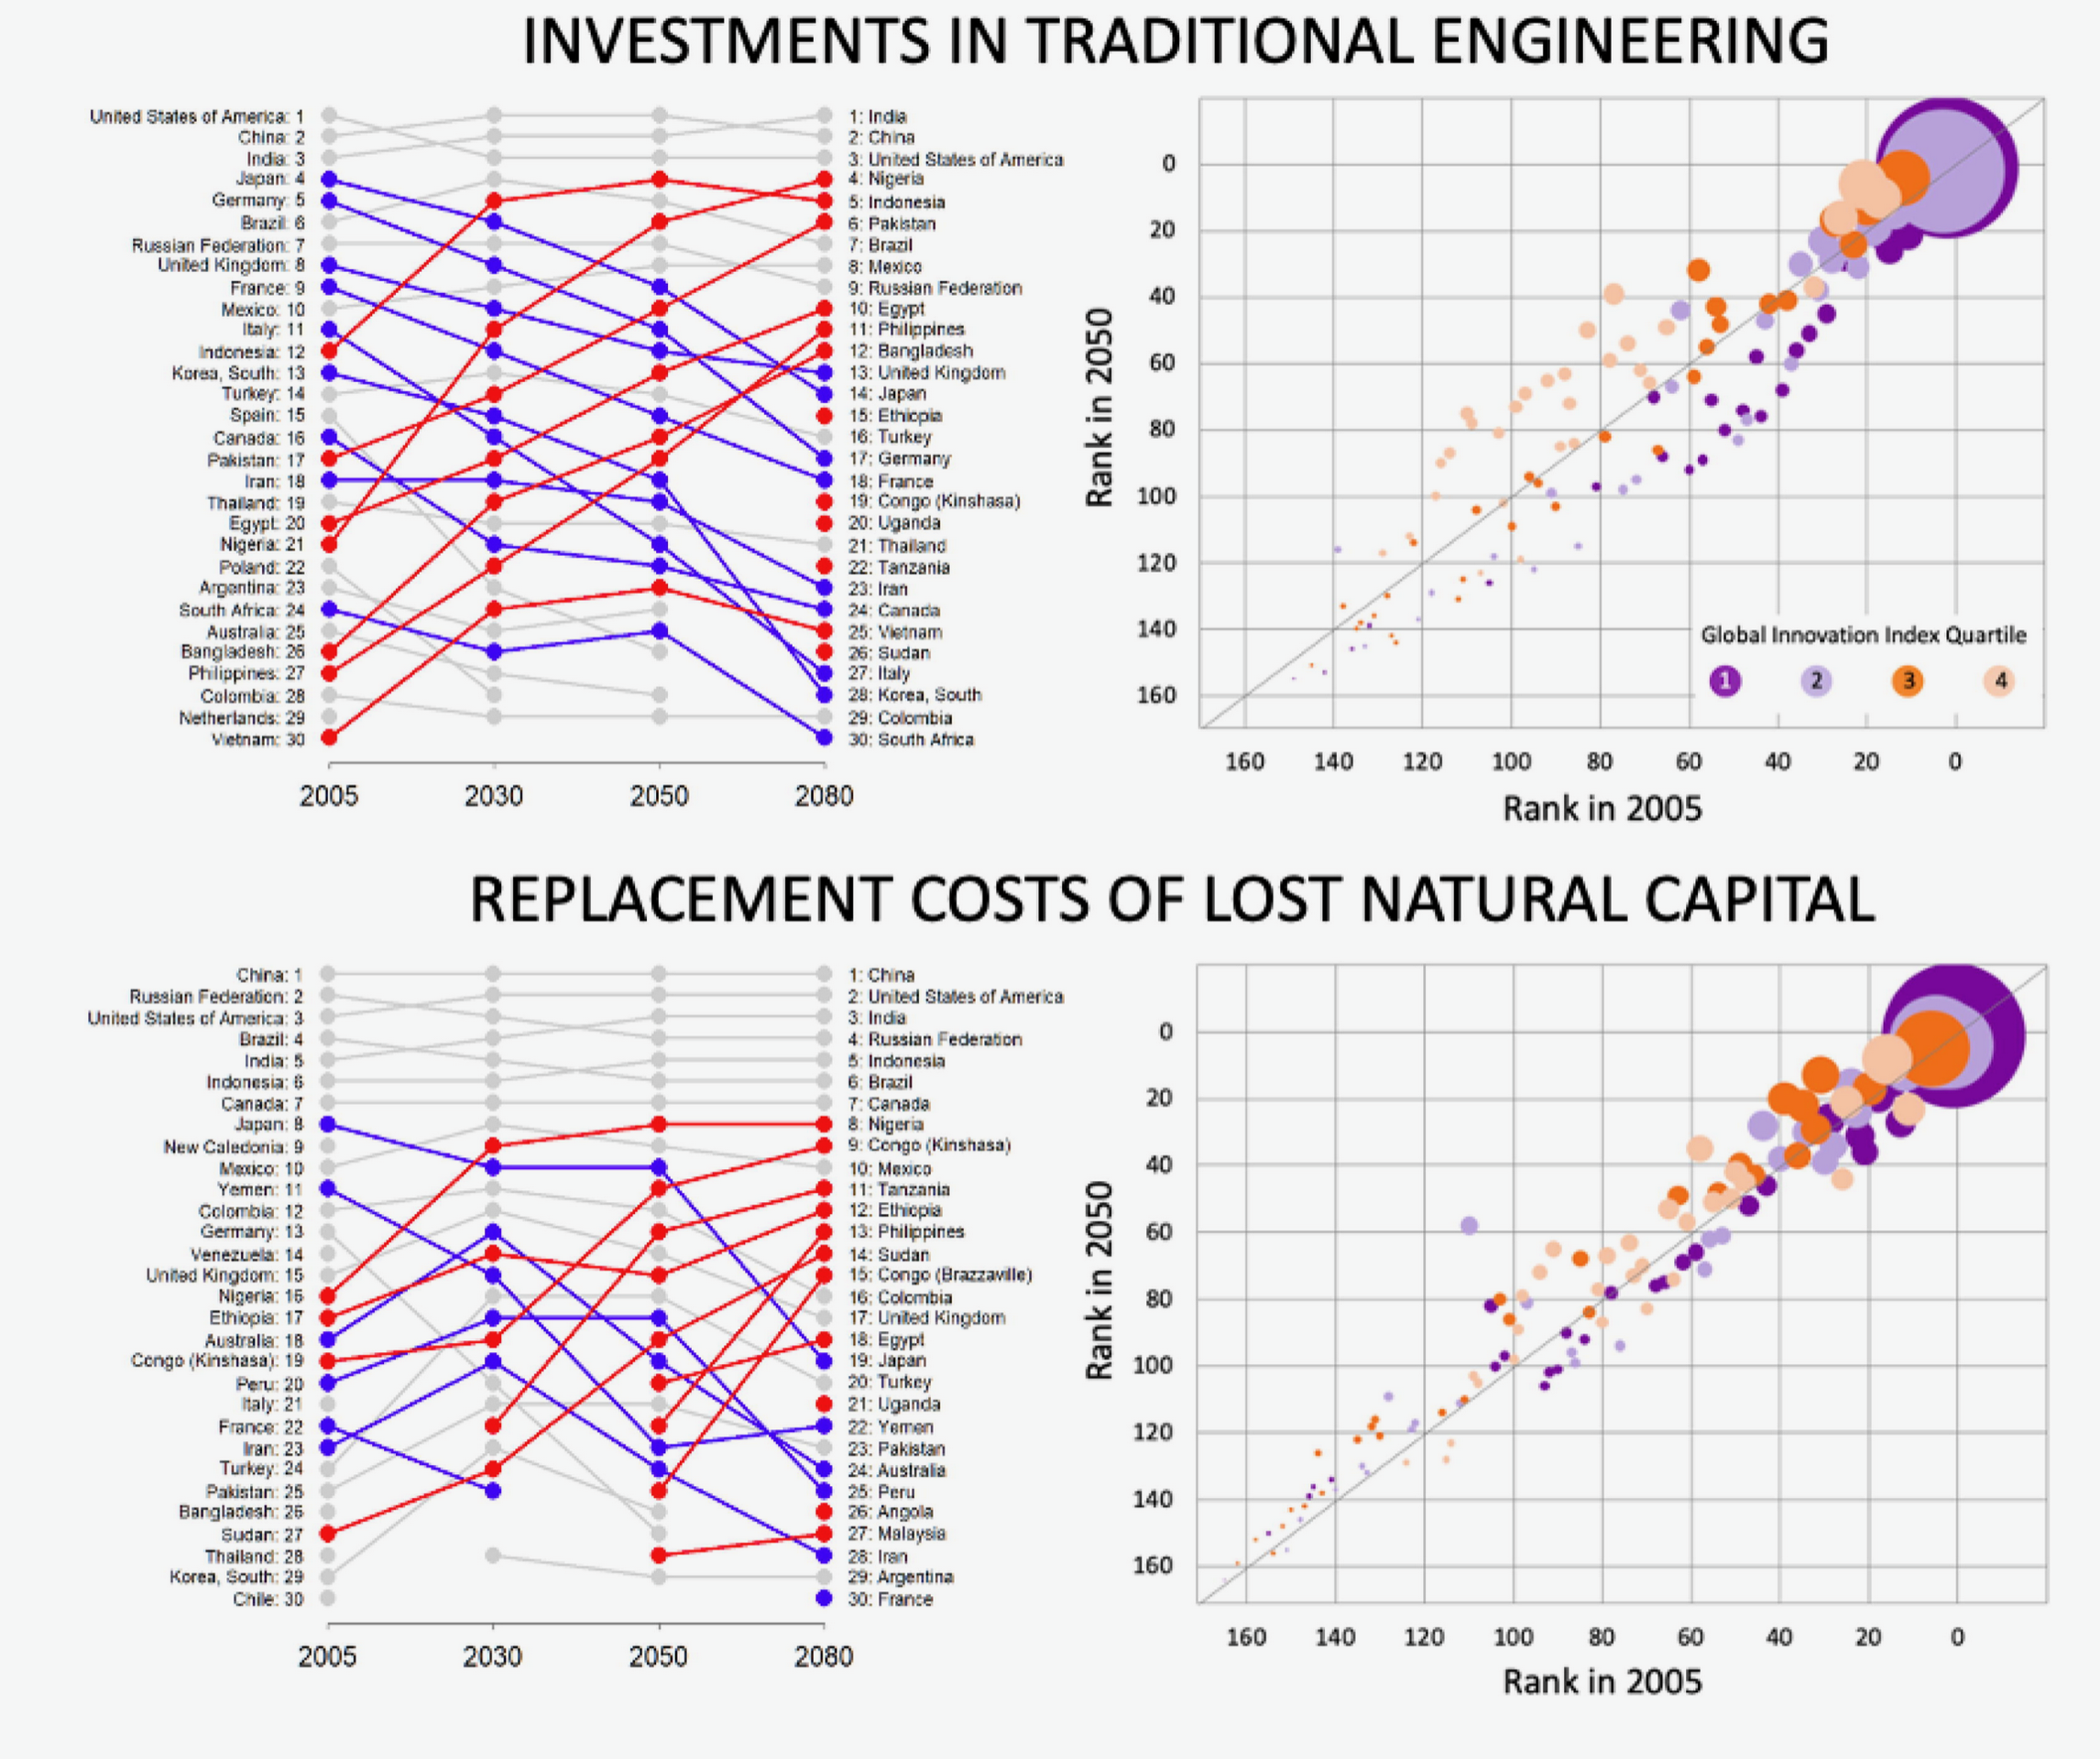
Fig. 9.
Nations ranked by projected expenditures on TE investments and
replacement cost of NC. (left panels)
Countries labeled in red experience the most rapid relative
increases in required TE expansion ($TReng),
while also incurring increased cost to replace NC ($). These
tend to be poor countries. Countries with general declines in both variables
(labeled blue) are typically richer. (right) Rankings (1=highest) in
2050 versus 2005, with colors reflecting quartiles of a 2017 index of
institutional capacity, technology, and human capital (Cornell University et al.,
2020) (highest index score [purple] =1, typically more wealthy countries); sizes
indicate expenditure levels. Countries above 1:1 line move
to higher rank in required expenditures/penalties. Relative to rich countries,
the developing world faces the dual challenge of financing more rapid deployment
of traditional water engineering while simultaneously coping with degraded natural
capital, which itself increases the costs of water resource systems.
References
BLS, 2020. CPI Inflation Calculator. https://data.bls.gov/cgi-bin/cpicalc.pl. Accessed 25 Jan. 2021.
Cornell University, INSEAD, WIPO, 2020 The Global Innovation Index 2020: Energizing the World with Innovation World Intellectual Property Organization (WIPO Geneva, Switzerland, https://www.globalinnovationindex.org/home.
SSP Public Database, 2012-2015 (2016). https://tntcat.iiasa.ac.at/SspDb.


